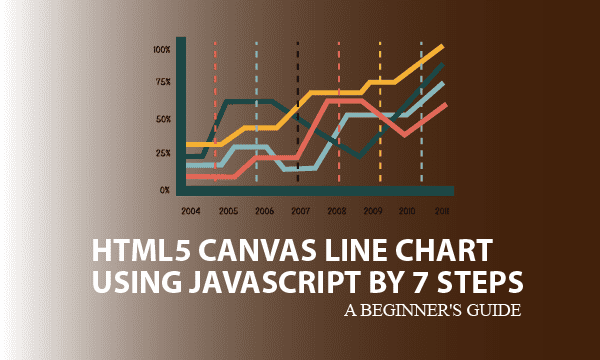
HTML5 Canvas Line Chart using Javascript by 7 Steps
We are proposing an elegant approach to draw HTML5 Canvas line chart. Each line illustrates the distribution of one series of data, and we allow multiple series to be sketched. This article divides the drawing procedure into 7 steps for which several sections explain the principle and usage. All codes here are not complicated, so … Read more


